

News & Features
The New and Improved Novlr Analytics!

Over the last few months, we’ve been busy developing the new Novlr Analytics dashboard. We wanted to show you some of the key features to help you get the most out of your writing statistics.
You can access the new analytics in the same way as before – by clicking on Analytics in the dashboard menu. The updated analytics not only gives you much more detailed statistics on your word counts, but also shows you additional productivity information, new zoomable graphs going back in time to your first word, and your creative profile!
The new analytics dashboard updates in real-time, so you can see how much progress you’re making after every edit.
Who can use it?
Novlr Analytics is available to all Novlr users. Whether you’re a subscriber, or just on a trial, you’ll have full access to the analytics dashboard.
Through Novlr Analytics you’ll be able to see granular statistics on your word counts, writing speed, potential page count, and writing habits. You’ll also be able to see stats that are specific to individual projects, including words written each day, month, year, and cumulative word count across all time. This can help you spot writing trends, and set goals.
What’s new?
The new and improved Novlr Analytics is all about bringing you a more detailed and insightful look at how you use Novlr, with:
- Graphs that show your writing progress over time
- More detailed productivity stats, including word counts for each day and week
- A creative profile page with an overview of the different ways in which you use Novlr that we will be adding to over time
Words
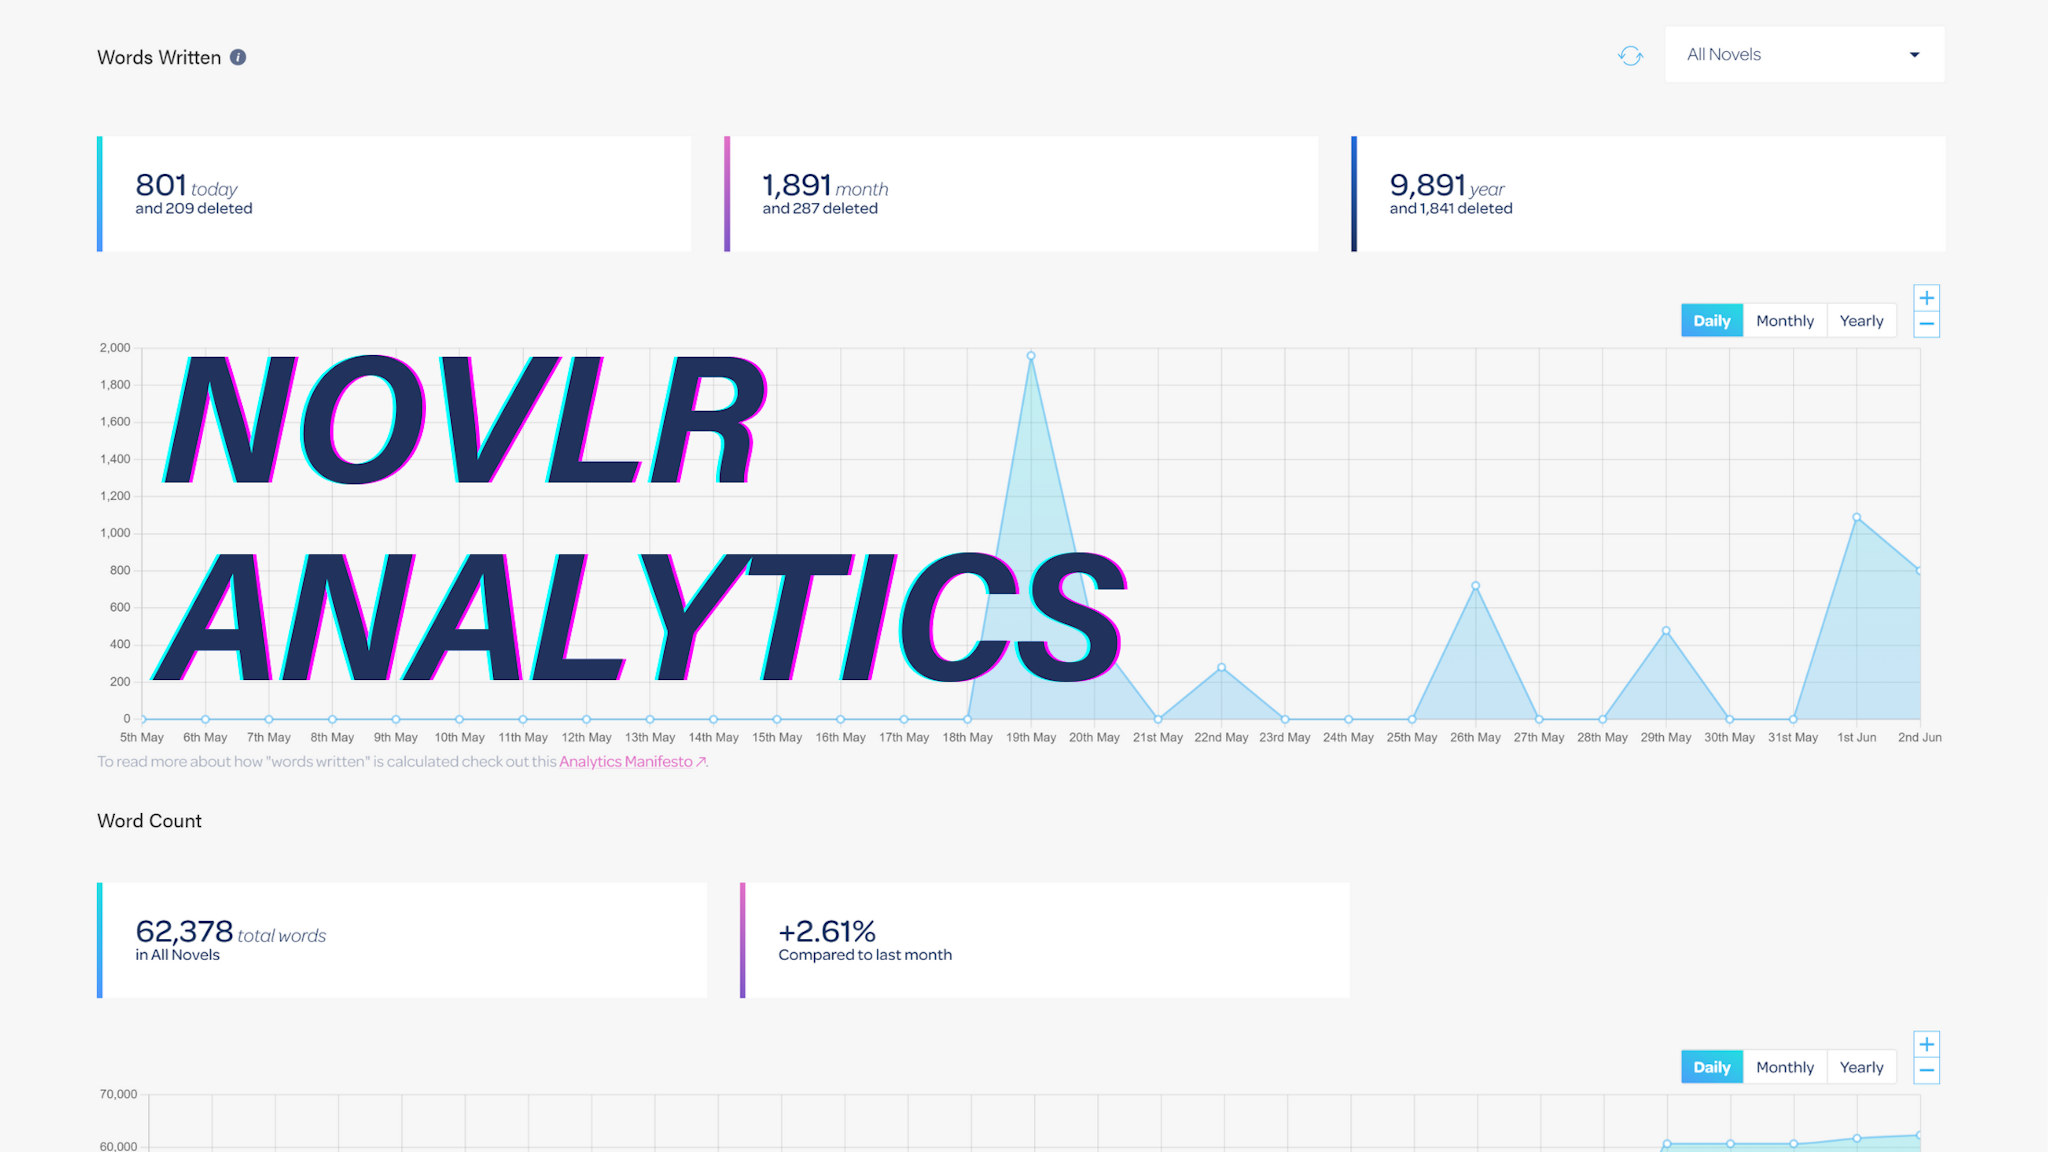
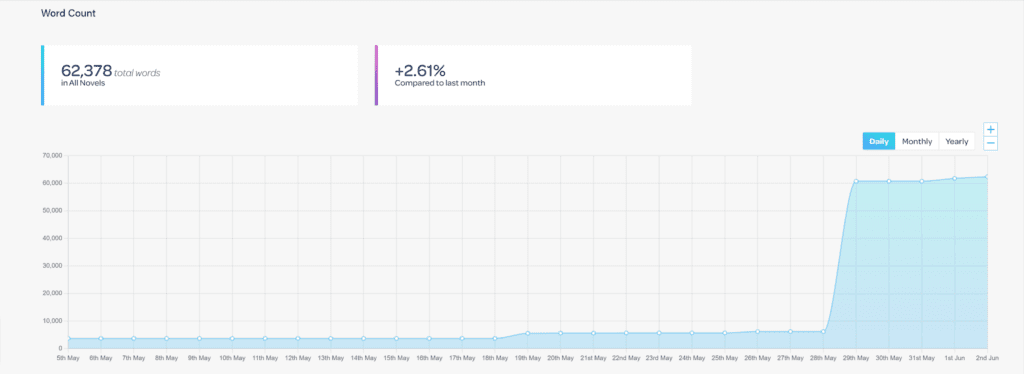
We’ve added graphs to your words written and word count statistics so you can see more of your writing stats at once. It’s a great visual way to see your writing data at a glance.
The graphs in Novlr analytics update in real-time, so you can see how your writing habits and word count have changed over time. You can see graphs in day, month, or year view, and filter these by project using the dropdown menu at the top right of each graph.
You can read all about how “Words Written” is calculated and more detail about how to use these two graphs – words written and word count over time, in our Analytics Manifesto.
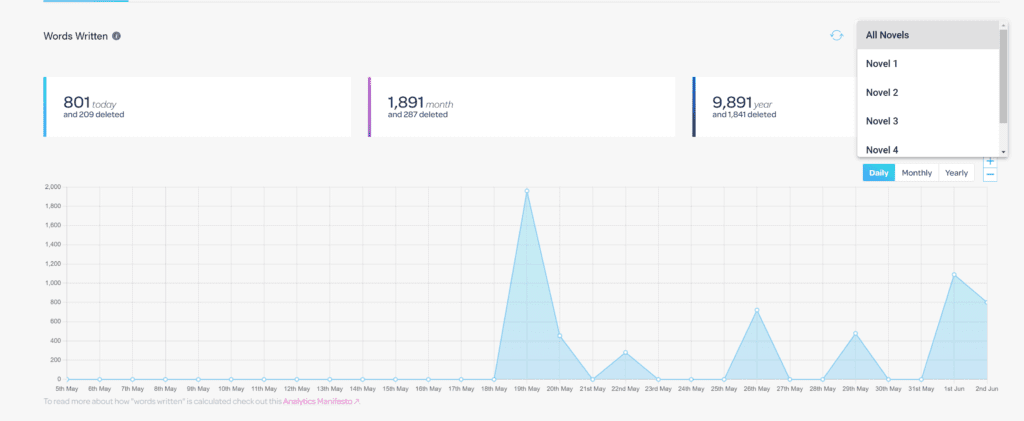
You’ll also see how much more or less you wrote this month than last month when viewing graphs for individual projects by selecting that project from the dropdown menu. This gives you an idea of whether there are any patterns in your writing habits.
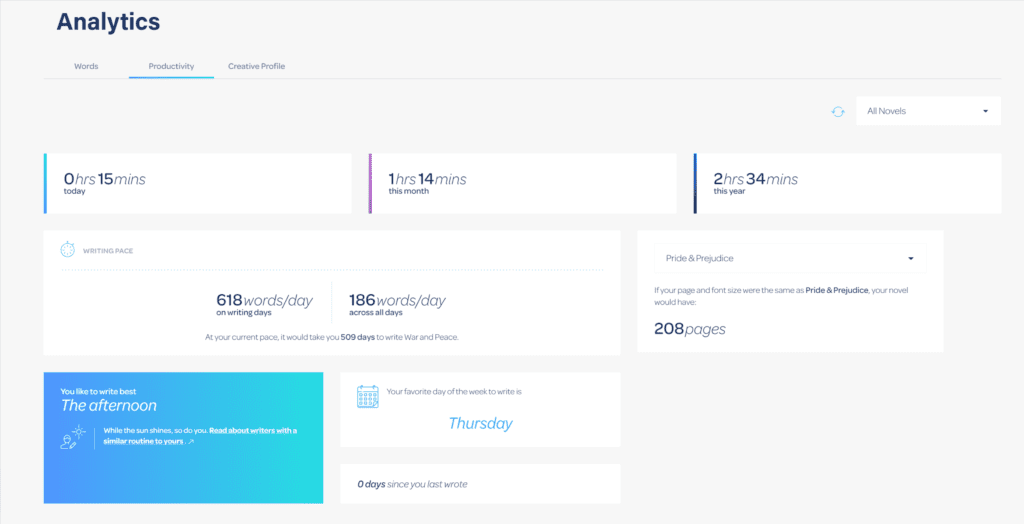
Productivity
We’ve added a whole host of brand new productivity stats so you can see how much time you spend writing each day, month, or over several years. We’ve also given page length estimations based on three different classic works (Pride and Prejudice, Dr. Seuss, and Great Expectations) so you know how long your book might be (this is a feature that you’ve requested so many times over the years and we’re so glad to get it to you in this release).
We’ve also included information about your writing pace, which is filterable per novel. And to help you make sure that the time you spend writing is quality time, the new Novlr Analytics also shows what time of the day and which day of the week yields the highest productivity.
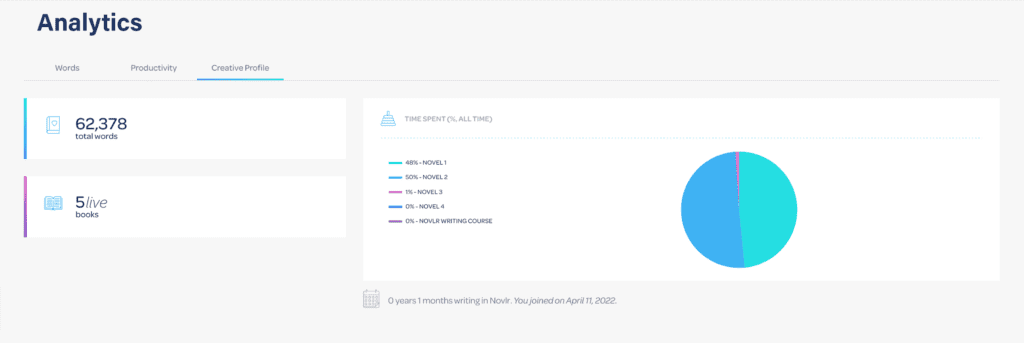
Creative Profile
Brand new to Novlr Analytics is your creative profile.
You can now see the projects you’ve worked on most. This will help you understand where your time is going, and how much of it is spent on which project. You may be surprised by the results! You can click on novel titles to include or exclude them from the pie chart to evaluate your split of time across projects.
You’ll also see your total word count written in Novlr as a single figure for easy access, as well as how many projects you’re working on at once.
We will be adding more to this section and would love to know what else you would like to see.
We’re really excited about the new analytics features and we hope that you are too. If you have any more suggestions for how we can improve them, or notice anything that doesn’t look quite right, then please let us know.
If you’re not a Novlr user yet and want to try out our awesome analytics feature, then sign up for a free two-week trial!